ATM also allows you to clear our some memory usage in your system. These capabilities are included to help you investigate how these OS features help with performance. Use of those buttons will most certainly degrade performance! Those running repetitive performance tests may also find the tool and these buttons useful to insure that a test result is not compromised by having file components already in memory. By clearing out memory, you can come closer to insuring a consistent state of the OS prior to any test run.
Download links are at the bottom of this page.
Click images to enlarge
What is the System File Cache?
The System File Cache is a component of the operating system kernel. It works in conjunction with the Memory Management sub-system and the IO sub-system to cache files that are currently in use, or more accurately portions of those files, in RAM. This important function significantly affects system performance by supporting sharing of commonly used files (such as system dlls) in memory, and avoids unnecessary disk IO.
What are the Standby Lists?
The Standby Lists include memory that was previously in use, is no longer in any active working set, but could be useful in the future. Mostly, the standby lists contain portions of files. If all uses of a file that is in the System File Cache (sometimes called the File Cache Working Set) are closed (assuming the file was not modified in memory), those memory blocks are placed in one of the standby lists. But process memory, including files, also is placed on the standby list. This happens when the process is done with the file, but also when the kernel reduces memory use on the system by reducing a process working set. The reduced memory may or may not be paged out to the page file, but in either case it is (eventually) added to the standby list. The standby lists are considered to be part of "available memory", which means that the kernel may grab that memory for reuse (referred to as "repurposed") when memory is needed. But while in standby mode, if the process needs that memory again, or if part of a file and the file system cache needs it again because another process opens the file, it can be moved from the standby cache back into active memory just by manipulation of the virtual memory pointers.
What is the "Superfetch"?
Superfetch is a term used for both a feature, and the service that (largely) implements the feature. Superfetch is new in Vista and later operating systems.
The Superfetch Windows Service that supports four performance enhancing features, ReadyBoot, ReadyBoost, Application Prefetch, and "Superfetch" (the feature). The Superfetch feature should be disabled via registry, not the services control manager, to allow the service to support the other features.
The Superfetch feature is enabled by default on desktop operating systems and disabled by default on server operating systems. Superfetch monitors file usage and causes the OS to pre-cache portions of files directly into the standby lists that you are likely to need in the future. In theory, superfetch improves performance in systems with lots of memory by pulling these files in on a low priority basis.
What is the "Memory Compression"?
Memory Compression is a new technique added to the Threshold build of Windows 10, and significantly modified in the Redstone builds. Basically, rather than page private data out to the page file on disk, the OS can compress it in memory to recover a portion of the memory, and possibly page it out in compressed form.
What am I looking at?
ATM was designed for IT professionals, not your average user, so there is a lot stuff on the screen. But just start with the graphs on the right.
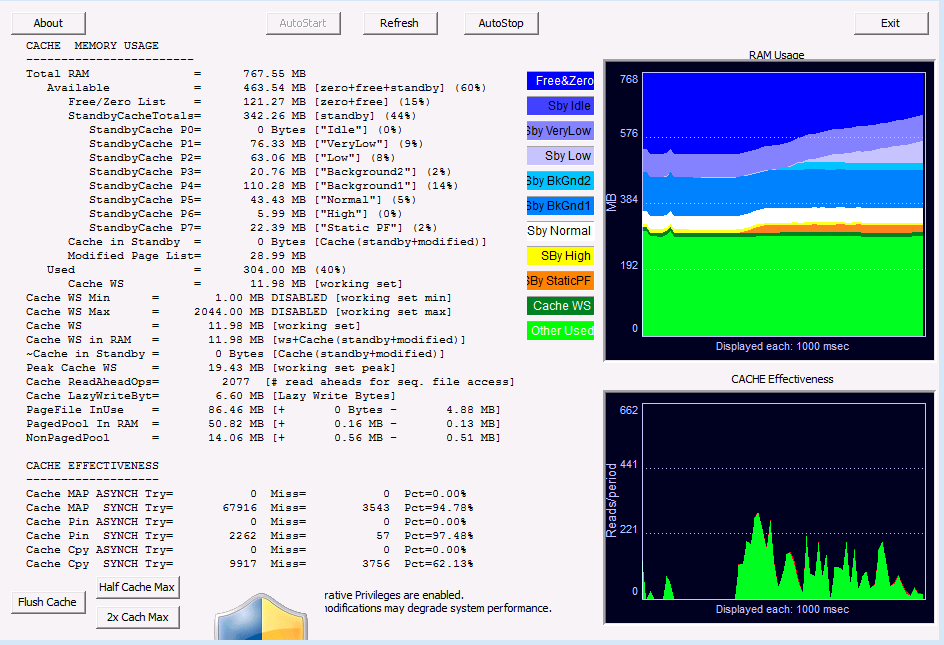
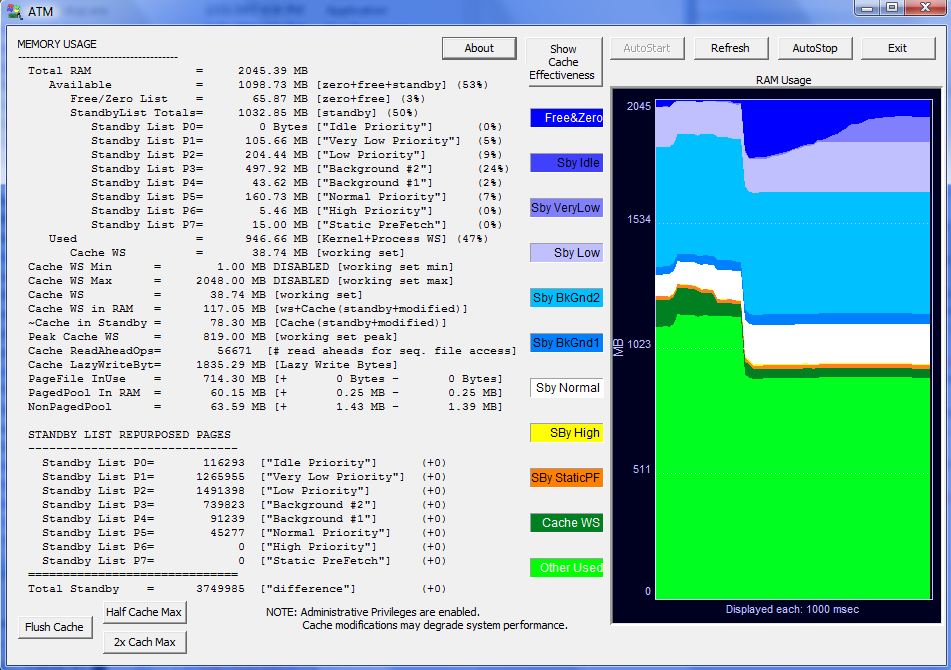
The graph provides a view of RAM (memory) usage. It is a historical graph showing the last 60 seconds with the most recent interval on the right. The "green" based categories at the bottom reflect what is considered "Used Memory" and will match up with what the Task Manager reports. The yellow and blue based categories above reflect what is considered "Available Memory". The red category shows if any RAM has been detected as bad by the OS and will not be used. You probably do not have any bad ram on your system.
Within the used memory, we separate out the amount of that memory which is in the System File Cache Working Set. Also called out are memory in the Modified and ModifiedNoWrite lists. These represent modified files that have not yet been flushed out to disk. The OS is slow about writing modified pages out, and you may see more memory in use here than you expect. The modifynowrite holds modified file portions for files that were marked as temporary.
There are a lot of categories in available memory. Processes usually get memory from the Zeroed memory pool (the contents have been cleared), but in certain situations it can get it from free memory. Free memory most often includes dirty memory released by a process (memory buffers), but will be overwritten before being given for reuse. The standby categories may be reused with their contents, but are available to be stolen and zeroed to keep the Zeroed memory pool with sufficient capacity. Memory would be taken from the lowest priority standby list first, when needed.
Note that on older OS's, the graphs are much simpler as the OSs do not support as many features, or provide as detailed information out of the kernel.
By default, Page File activity is shown in the lower graph.
If you select the "Show Cache Effectiveness" button at the top of the dialog, the graph on the bottom right is replaced by a Cache Effectiveness graph, which looks at some low level counters provided by the System File Cache subsystem on what a wonderful job it is doing. In addition, the text on the bottom left will change. This bottom graph shows a historical view of system file cache activity (file system requests for files that might be cached), and the effectiveness of the cache in having what is needed on-hand. A miss occurs only if the requested file portion is not in the working set or may be recovered from one of the standby pools. These values are as reported by the OS.
Click the button again to remove the lower graph and allow the top graph to expand. Click again to bring back the layout with the Page File historical data.
The text on the left of the display provides greater detail and additional interesting things to look at. At the bottom of the memory section is information on if Superfetch is working or not.
What does ATM cost?
TMurgent believes in giving back to the community. ATM is free for for use by consultants and enterprises. The exception to this is that we ask ISVs that want to use this tool in their labs to contact us for a license.
How does this tool work?
The tool makes use of published APIs, when applicable, but also uses some unpublished kernel interfaces to obtain information or request system modifications. The tool understands the differences between versions of the operating system and adjusts to those differences.
What OSs will it run on?
The tool will run on Windows 2000 through Vista and Windows 7, 8, 8.1, and 10. At the time of this writing, the Windows 10 1803 version is the latest tested. 32 and 64 bit versions are provided.
Doesn't the Superfetch prefetching itself slow down my system?
Microsoft says no. I say "not as much as you would think". The requests to pre-cache happen in low CPU priority threads. In addition, these new OSs support prioritized IO, and this pre-fetch is using low priority IO requests. You can also say that the memory used is low priority since it uses the standby reserve, which is a lower priority than standby-normal priority or standby--core from the viewpoint of freeing up memory for the zero page list. Still, only if your system is truly idle for a while would it be transparent. My Vista PC with 2GB of ram will typically have a standby reserve of 500MB to 1.3tmtnGB of stuff - and that is a lot of I/O when it first comes in. Unless I went for coffee (which I do a lot) I will notice it somewhat. But overall, I believe my system operates faster because of it. And I can always test that by simply turning off the service (but I don't because it is helping).
How do I install it?
No installer. Just download, unzip, read the readme, and copy the exe somewhere convenient.
Are there more free tools?
TMurgent has a bunch of tools on this page. Usually they are free, unless you are a Software Vendor. Additional tools for performance have a segregated list here.
Here is the latest version ZIP package: DOWNLOAD ATM 3.8 (2.1MB)
Here is the previous package: DOWNLOAD ATM 3.7 (2.1MB)
Here is the previous package: DOWNLOAD ATM 3.4 (2MB)


