Launch Time Analyze
Purpose:
LaunchTimeAnalyze is a tool to measure Perceived Performance,
a measurement of the performance of systems as perceived by the end-user.
Requirements/Installation:
The product requires Microsoft .Net 3.5 or greater.
If you install using the provided setup.exe, it will install it for you.
Installation is straight-forward, your only option is for the installation path.
This is a 32-bit program and will work on either 32-bit or x64 systems.
Background:
Please visit the White Papers section of the website to read a white paper about Perceived Performance.
The purpose of this tool is to act as an automated command launcher, which will repeatedly run a test while measuring the amount of time it takes to complete the test. Because the act of measurement can affect test results, it is best if the test is a remote test involving another system, hopefully using a known latency network connection.
Normally, the test is performed a large number of times in order to quantify what the user might experience in running such a test in the wild. 500 repetitions (called rounds in the program) is a reasonable number for most applications of this tool.
For the “round script”, I like to use the IcaLauncher, or RemoteLauncher programs.
These are also free tools that are part of the PerceivedPerformanceToolkitForCitrixServers zip file that is included in the ToolCrib package.
You can locate the ToolCrib package in the Tools section of the website.
These tools will open a remote connection, via ica or rdp, using the current user logon credentials and run the requested application.
The application to be run on the remote server must be self running.
The Toolkit includes a self running program (ServerTestApp), but you can easily create your own using AutoIT, for example.
Building up a remote script that accurately simulates the user behavior can be substantial work.
See ProjectVRC for some great ideas on how to simulate full user workloads.
Setup:
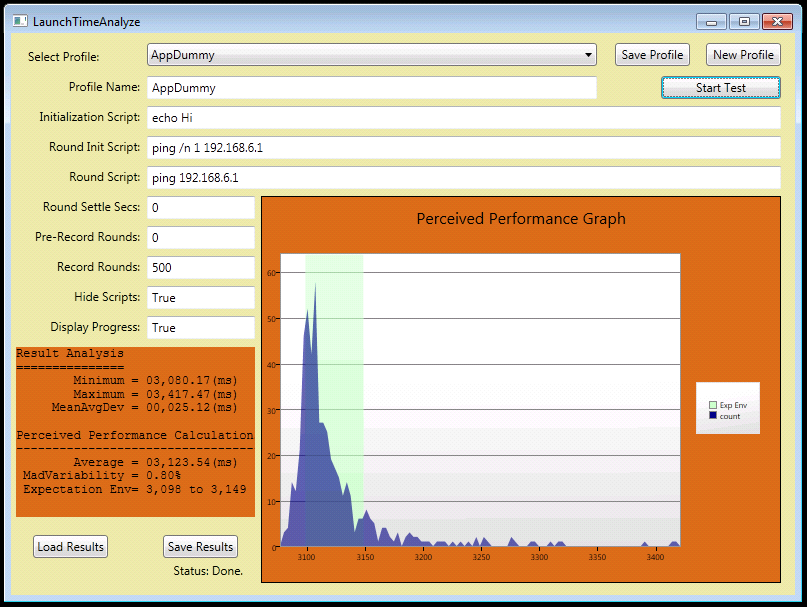
Setup involves creating a profile of test parameters. This profile may be named and stored in the Windows Registry so that it is convenient to repeatedly test several scenarios.

A Profile consists of the following items:
Profile Name: A name used to identify the profile.
Initialization Script: The first script run after the "Start Test" button is clicked. This script is only run one time during the test and is suitable for initializing things. This script might establish connections, or clean up from prior tests.
Round Init Script: This script is run at the beginning of any round. The time to complete this script is not included in the results.
Round Script: This script is run each round. This is the script measured for time to completion for each round.
Round Settle Secs: The number of seconds to wait between rounds for systems to settle.
Pre-Record Rounds: Sometimes it is preferable to warm up a test with some rounds that are not included in the recording. This item controls the number of such warm-up rounds.
Record Rounds: Number of recorded rounds to run.
Hide Scripts: All scripts are run in a cmd window. Any scripting language supported by the OS may be used. This item should be set to either "True" or "False" to indicate if the cmd window running the script should be hidden or shown.
Display Progress: Item may be either "True" or "False". When "True", a chart showing the tests completed and their resulting values will be shown and updated while the tests go on.
Analysis:
The final analysis displays a Perceived Performance Graph, indicating the number of times results fall within certain delay buckets. The number of buckets and their size are calculated based upon the result data. This graph provides a visualization of delays experienced by the user during the test.
Minimum, Maximum, and Average (Arithmetic Mean) values are calculated and displayed, in the result box to the left.
Mean Absolute Deviation is also calculated and displayed. MAD is a measurement of the average instance of the "absolute value of the difference between the mean value of the test and each value". In essence, we use this as an indication of how far off the mean the user should expect responses to fall.
MADVariability is also calculated and displayed. This value is the ratio of MAD to the Average (expressed as a percentage). This value is a measure of how consistent the results are, taking into account the total expected wait time.
Expectation Envelope is also calculated and displayed on the Perceived Performance Graph. This envelope runs from the Average minus MAD to Average plus MAD. A user would normally expect results to fall into this range and would be surprised (good or bad) when things fall outside this range.
What Does It Cost?
LaunchTimeAnalyze is free to use.
Where Can I Get It?
Download it here: http://www.tmurgent.com/download/LaunchTimeAnalyze.zip (850k)
Additional tools for performance have a segregated list here.