AppV 5 Client Profile for xPerf
Version 1 August 15, 2013
Download links and version changes at the bottom of this page.
 | |
xPerf Profile wprp file for the App-V 5 Client is a profile configuration for xPerf designed to make it easier to capture data for advanced debugging of App-V 5 issues.
|
The Windows Performance Toolkit (xPerf) is a free tool that is part of the Windows ADK for Windows 8. But don't let the name fool you:
- It may be run on Windows 7 or Server OSs also.
- While the tool was designed for you by Developers looking into performance related issues, it can also be helpful when debugging.
- It is called xPerf because the command line utility is called this. But it is easier to work with using the GUI interface, as shown in this post.
The tool combines the capture capability of Perfmon, along with a lot more data about additional activities. While Perfmon might be the first tool I grab to look at a problem, if I can't find the problem quickly then I switch to xPerf.
xPerf capturing may be customized by providing your own profile. The profile (stored in a file with a wprp file extension) is loaded into the cauture tool and selected before starting the capture. The profile that I have provided as a download on this page has been customized to include file, registry, network, process and thread, and CPU data along with all of the App-V debug provider events.
This capture provides a rich trove of data, organized in a single timeline, so that you can get a broad view of what is happening when an error occurs, with deep drill down capability to see the low level detail.
|
Installing xPerf Download the Windows ADK for Windows 8. Install, but you only need to select the Windows Performance Toolkit component.
Configuring xPerf Download the profile from the link at the bottom of the page. Extract the wprp file from the zip and place anywhere convenient. Launch the recorder utility (from the Start menu, select All Programs, Windows Kits, Windows Performance Toolkit, Windows Performance Recorder). Select the "show options" button.

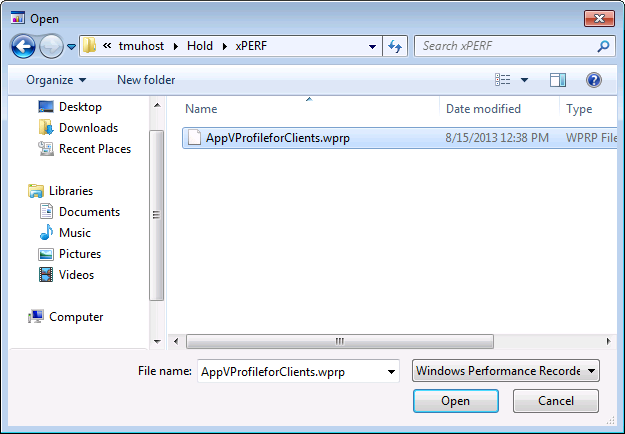
Browse to and select the wprp file.

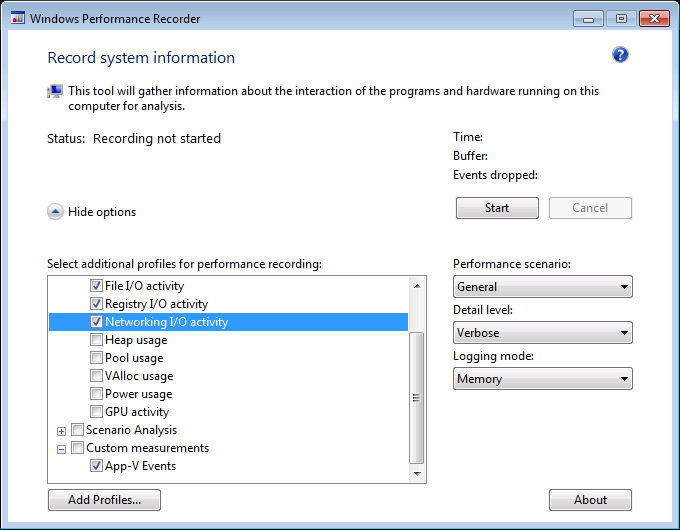
Now select the standard CPU, FIle, Registry, and Networking activity checkboxes along with the App-V Events.

You can usually leave the options on the right alone. I prefer memory logging to avoid additional file I/O events. If you notice events dropping, or if the buffer over-fills you can change it and retest. When the buffer overfills, it overwrites the oldest entries so it's probably OK for most troubleshooting anyway if you stop and save off the capture as soon as the problem occurs. (Note: recording continues anyway; if you want to then stop recording you must use the Cancel button.)
Looking at results From the start-menu, select Windows Performance Analyzer. Click the arrow on the graph selections on the left to pick the graphs to add. I usually start with the Process Lifetimes so that I can zoom the view into the correct timeframe, then add under Storage pick "Registry Count by Operation" (or by Process), "File Activity by Process", and "Generic Events". Then I remove the timeline if I don't need it.
|
EXAMPLE: In the analysis below, you can see registry, file, and event monitors associated with an application launch problem. Because the app produces an audable "ding" when it puts up an error dialog box, I viewed the detail view of the file by process window, located the "Path" columne and then right-clicked to "find" the .WAV file opening to show when on the timeline the system .WAV file was opened. (This is the blue vertical line seen on the other graphs) So I know the error occurred just before this point and can zoom into activity just before that time.

What does the Profile cost?
TMurgent believes in giving back to the community. The Profile is free for for use.
Are there more free tools?
TMurgent has a bunch of tools on this page. Usually they are free, unless you are a Software Vendor.
Tools for performance have a segregated list here.
What is in the latest updates to the tool?
Version 1
Where Can I download it?
Here is the ZIP package:
Compressed copy of the file (~2kb)