There is nothing like a good set of tools ready when you have a repair project to do. But too many tools are distracting.
Working with App-V 5 through all of the pre-releases and now the final release for some time, I have settled on my three favorite tools. And it is time to let you in on the secret.
The Screwdriver
The screwdriver is the most handy of the tools. It is the one always just there, sitting right on the workbench where you need it. I don’t have to go looking for it. For me, my screwdriver for working with App-V 5 is the Windows event logs. Nothing to go get. Just pop open the event viewer that is already part of the OS and you can see what is going on.
Microsoft has toned down the cryptic error codes and messages presented to end users in 5.0. Previously, I could have a pretty good idea what is going wrong just be seeing the error message. Well, maybe plus a little googling or my Failure to Launch tool. But in the new release, the error messages are fewer and less informative to me (not that the old messages were informative to end-users).
So in 5.0, the Event viewer is my screwdriver. but don’t go looking in the Application log. In this release, Microsoft has segregated out the App-V logs into their own space.
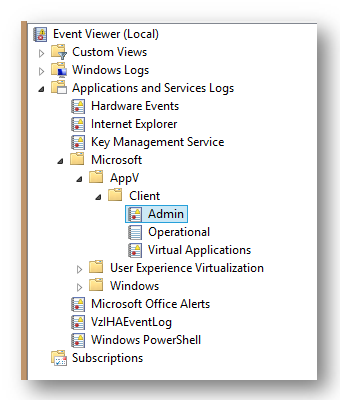
Look down to the “Applications and Services Logs”, pry that open, and then pop open the Microsoft folder and find the new App-V event logs. 
As you can see, there are three separate logs for the App-V Client. The good stuff, meaning the errors that you are probably looking for, go into the Admin log. The Operational log is more verbose and gives you a better idea of what the client is doing and when, but most of those messages are informative things like “I’m streaming something”. I usually look in the Operational log only if the Admin log didn’t provide enough detail.
The intriguing sounding Virtual Applications log is usually empty. By usually, I mean that I have never, ever, seen a logged message in there and I am unaware of anyone who has.
With some digging, I discovered that there are four messages that can be written to the log, and they seem to deal with special VFS errors that might prevent an app from launching. But I’ve never seen them, not even with the VFS problem this week that caused me to go looking for my tool belt.
The Side Story
I have this app I wrote. I write a lot of my own little tools, some that end up in the tools section of the TMurgent website, but also a lot that don’t. Often, such as the case with this tool, the tool is special built to do just one thing. Usually not a very exciting thing, but to do just that one thing. These tools are like those surgical instruments they slide into a vein with a camera to go look at something. The purpose of this tool isn’t important, but it was written to clearly identify what App-V would do when an app did this one particular thing. So I sequenced and ran it in the client to see. The tool worked as planned, and I documented the results in our training “companion guide” to explain how the client works.
But then I gave that section of the doc to my daughter Kate for verification. Kate graduated from college last year and has joined the company, mostly as part of our custom sequencing service, but sometimes doing projects like helping me on this project, or co-writing our book PowerShell with App-V 5. Any way, she sequenced and ran the app, but came up with an error dialog that hadn’t happened for me.
 When she launched the virtualized app on the client, this error message would pop up. The application required elevation, and this would pop up just before the prompt for credentials. After entering credentials, if you just click the button to close the dialog, the app then worked as it was supposed to. As you can see, the error dialog is not terribly informative (can’t give end-users useful information now, can we?). So I pulled out the ever present screwdriver and looked into the new App-V logs in the Event Viewer.
They weren’t much help in this case, pretty much letting me know what I already knew. Something was wrong, and maybe the VFS was involved.
The Hammer
When the screwdriver doesn’t work, I usually go looking for the hammer. It usually isn’t sitting on the workbench (the VM I’m working on), but hanging at arms length on the wall. Or in this case a file share. For me, the hammer is Procmon. If there is an environmental problem the hammer can usually beat it into submission.
But as I looked at the hammer, it just didn’t feel right to me today. I don’t know why, but I decided to abuse the screwdriver already in my hand.
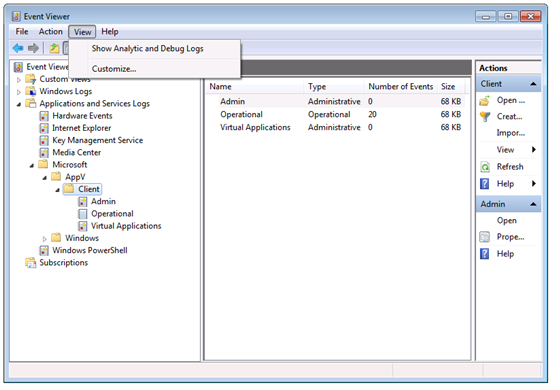
You see, just the day before, I had noticed something in the Event Viewer when looking at an XenApp issue unrelated to any of this that I hadn’t noticed before. The event viewer has an item under the View menu to show additional logs.

The Secret Debug Logs revealed
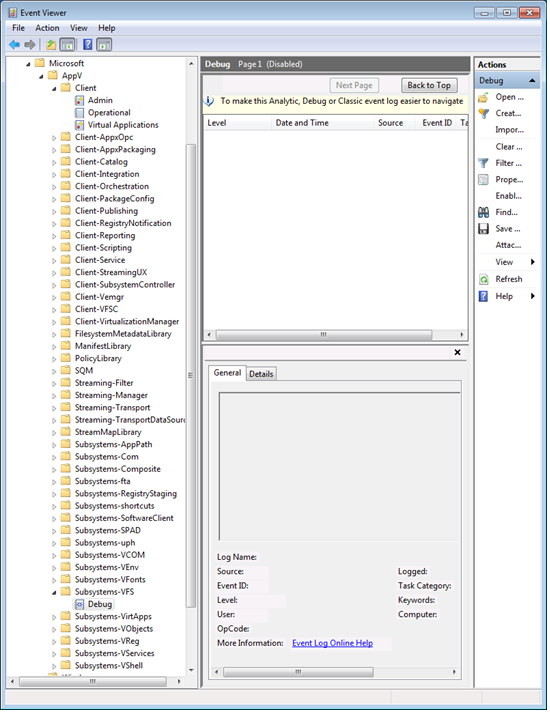
So I pried off that lid with my handy screwdriver, and looked down to the App-V logs. Wow!

Microsoft has provided a ton of very specific debug logs for App-V. Each of those additional folders you see have a single debug log under them. These debug logs are disabled, by default, but we can turn them on when we need to.
A Side Note about Eventing, Debug Logs, and Performance
When you right click on one of those Debug logs you can enable the log file. But you get a warning that doing so might cause events to be dropped. Ignore that. I mean, you wouldn’t want to leave any of these logs enabled in production, but you aren’t going to have a problem enabling these for a test.
The Microsoft App-V client, like all of the rest of the Microsoft (and many ISV) software, are constantly sending a stream of messages using a facility of the OS known as “Event Tracing for Windows”, or ETW for short. ETW is a highly efficient facility. A process running in user mode queues up a message and calls a utility. The utility context switches to the kernel and deposits the message in a queue, without any processing, and returns to the running process.
Sometime later, a kernel thread will wake up and process the queued up messages. Any software running on the OS can register with ETW to receive certain messages. The event viewer is the primary facility that registers for some of these messages. But normally it only registers for a small percentage of the message categories that exist. And any messages that are not registered for just require freeing the memory when this kernel thread wakes up.
To summarize, all of this logging, determining that nobody is listening, and discarding of ETW messages is always going inside the OS today already.
The Reciprocating Saw 
Which brings up the other tool in the workshop, the Reciprocating Saw. This is the most powerful of tools, capable of taking down a house. I’ve owned one of these for 25 years and probably only used it a handful of times. In Windows, when the hammer won’t do, I pull out XPerf. XPerf lets me register for any and all ETW messages, log them and then pour through the details in a very well designed user interface. I didn’t need to pull out XPerf today, but when you need a really powerful tool, go looking for this one.
So back to the no-longer Secret Debug logs and my problem.
So all enabling one of these secret debug logs does is to register certain messages to be sent to the event viewer log file. If the developer was sending thousands of messages per second towards a log file, enabling the log could have a significant performance impact. Thus the warning. But so far, I haven’t seen that effect with the App-V Client Debug logs that I have enabled.
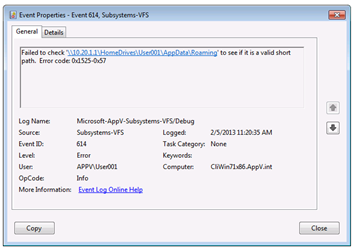
Since the error message to the user, and standard App-V error log info, hinted at maybe a network or VFS problem, I wanted to look at logs related to those areas. Because the app worked for me, I decided to focus on VFS, and enabled (amongst a few others), the “Subsystem-VFS” Debug log. Tried the app. Refreshed the Event Viewer app to see if anything appeared. The message that was in the log then showed me right where the problem was. All with using just a handy screwdriver!
The Problem Revealed
 My lab setup primarily uses local profiles. But I do have a couple of test user accounts in the domain that were set up for some roaming profile / folder redirection testing a few weeks back. And from this message I immediately knew that Kate had logged in using one of those accounts. The error, it turned out was a combination of the app elevating and permission settings in the remote home drive!
I probably would have found this if I pulled out Procmon, but this was way faster than sifting through a ton of unimportant events.
So now the secret of the secret App-V 5 client debug logs is out. Have fun with it!
1 comment
Comments are closed.